Crime & Safety
Serious Crime Falls to Second-Lowest Level in 10 Years
In Fountain Valley, the total number of crimes like murder, burglary and motor vehicle theft fell to 1,500 in 2011, a 13 percent drop since 2002.
In 2011, the number of robberies, felony assaults and arson incidents in Fountain Valley hit their lowest level in at least three years, newly released crime statistics show.
The figures are part of an overall downward trend in the total number of serious crimes in the city, which have fallen to their second-lowest level since 2002, according to The Fountain Valley Police Department 2011 Annual Report.
The FBI classifies serious crimes such as murder, nonnegligent manslaughter, forcible rape, robbery, aggravated assault, burglary, larceny-theft, motor vehicle theft and arson as Part One crimes.
Find out what's happening in Fountain Valleywith free, real-time updates from Patch.
Last year the city had 1,500 total Part One crimes, the second lowest amount since 2009 when the city had 1,467.
Over the past ten years, the highest number of total Part One crimes took place in 2002, with 1,727.
Find out what's happening in Fountain Valleywith free, real-time updates from Patch.
That's a 13.14 percent drop from 2002 to 2011.
The new numbers are “pretty darn impressive,” said Sgt. Kurt Ulrich, the police department's spokesman.
“It’s certainly a great sign that Part One crimes are down,” Ulrich said. “We’re very proud of that.”
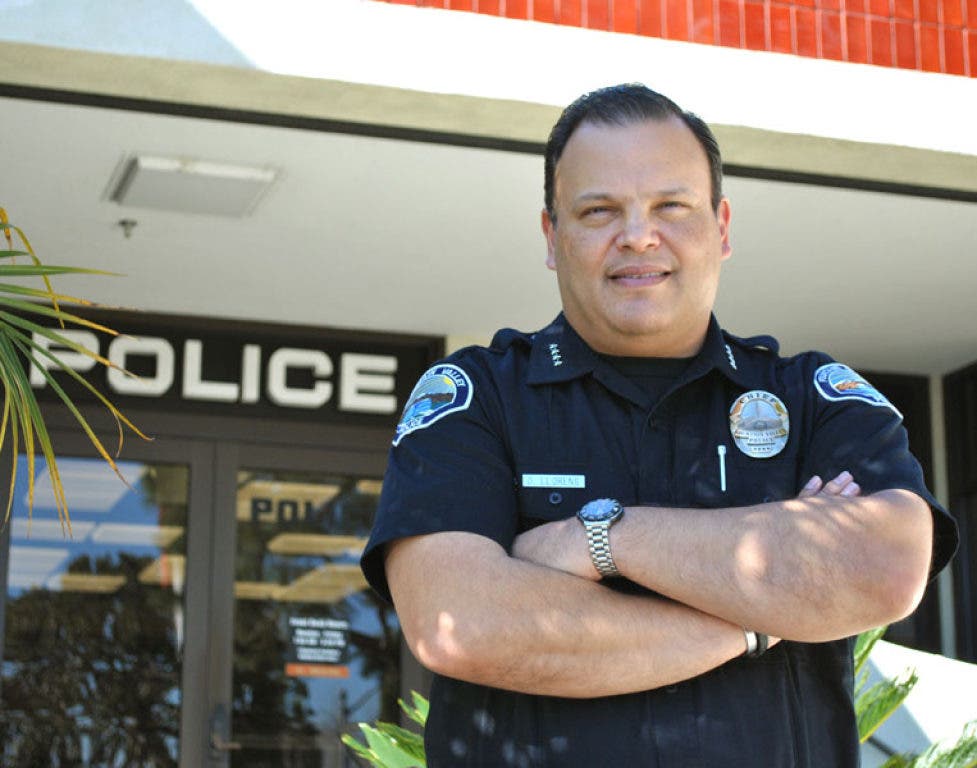
City Police Chief Dan Llorens said a number of factors contributed to the decline, including increased access to mobile phones, which help residents report crimes.
"We’re able to get information as it happens, so to speak, and so that’s a huge help,” Llorens said.
"Some good, smart police work” helped lower the numbers, too, added Llorens.
In 2011, there were 14 robberies, 56 felony assaults and one incident of arson.
Also last year, the city saw one homicide, down from three in 2010. However, last year there were eight rapes, the highest amount since 2003 when there were nine.
The FVPD posted the 2011 Annual Report on the department's website July 10.
Part One Crimes
2002
2003
2004
2005
2006
2007
2008
2009
2010
2011
Homicide
0
0
2
1
0
0
0
0
3
1
Rape
6
9
5
6
4
8
2
4
5
8
Robbery
33
43
31
30
36
40
36
33
28
14
Assaults - Felony
55
53
31
35
57
63
66
79
67
56
Assaults – Misdemeanor
110
114
122
156
154
152
168
176
198
141
Burglary - Residential
166
123
129
151
167
174
147
124
144
172
Burglary - Commercial
97
131
123
152
143
154
129
113
122
101
Thefts - Shoplift
201
201
147
158
153
146
146
148
187
174
Thefts — From Auto
479
468
481
391
438
435
452
406
440
424
Thefts Auto Parts
81
79
88
70
58
75
99
47
67
71
Thefts- Bicycles
36
22
34
35
17
22
52
34
35
35
Thefts — All Others
275
267
263
230
277
314
257
238
222
237
Motor Vehicle Thefts
176
158
166
196
125
123
93
60
75
65
Arson
12
6
6
10
6
5
9
5
9
1
TOTAL
1727
1674
1628
1621
1635
1711
1656
1467
1602
1500


